If this is true, then why does Aldi—which borrows a quarter per shopping cart and operates with a small crew that arranges shelves while taking care of customers—have a stronger emotional connection with shoppers than 90% of its competitors?
Yes, that's right. Aldi, known for its cost cutting and low prices, has– an emotional connection that is stronger than nine out of 10 traditional grocery stores.
Traditional grocers may take for granted that they have an advantage over non-traditional channels in the strength of their emotional connection with shoppers, but that doesn't appear to be the case at all. So just how bad is it for traditional grocers?
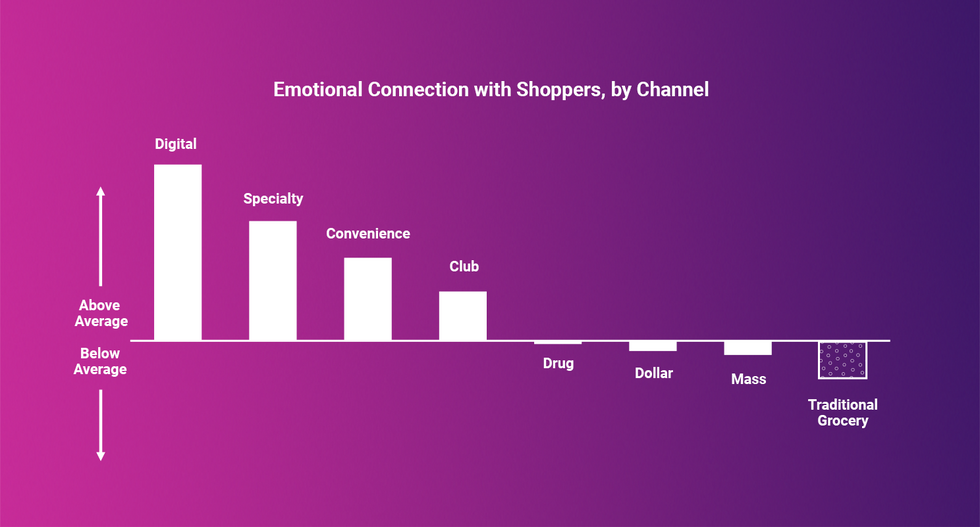
The inconvenient truth is that the average traditional grocery store has a lower emotional connection with its shopper than the average store in any other major channel where groceries are sold. While traditional grocers have been focused on selling groceries to the same towns for decades, non-traditional grocers have been able to move into those towns and secure a stronger emotional connection in far less time.
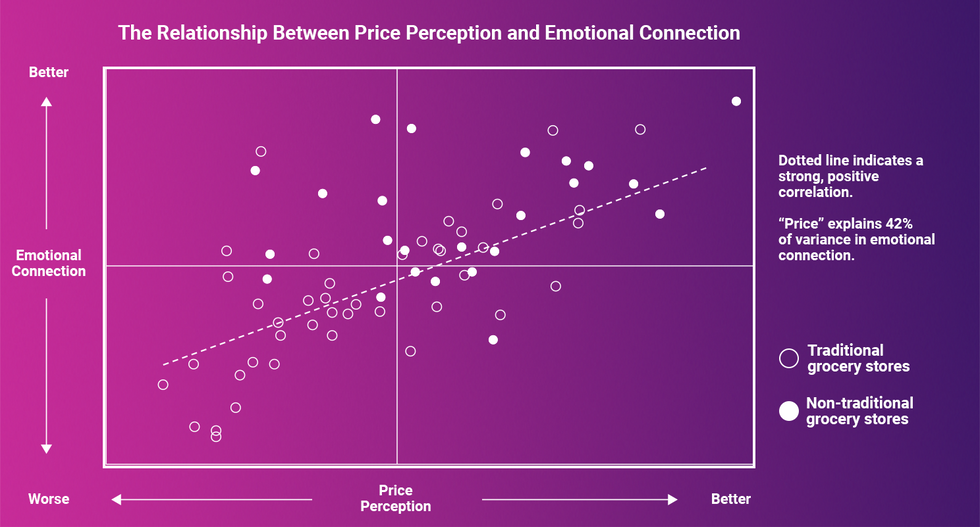
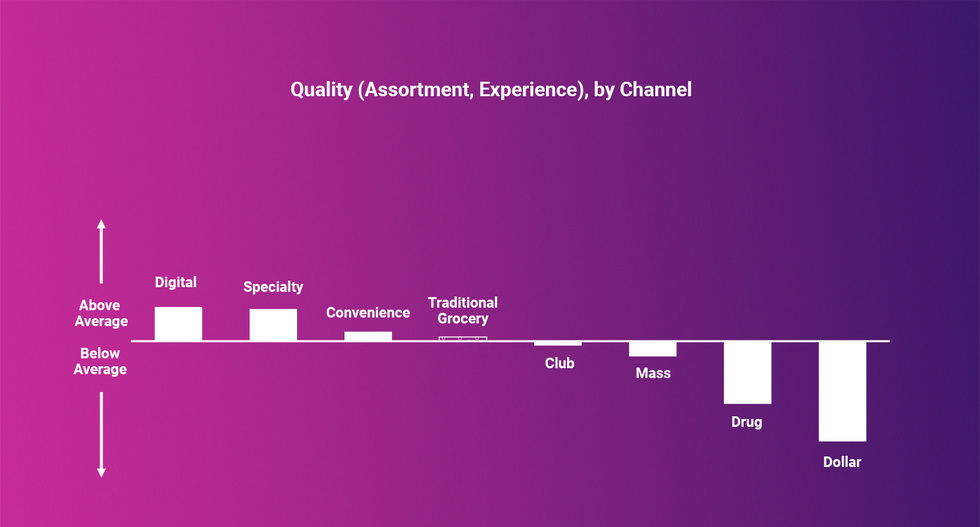
How? Well, it appears that emotional connection does have a price, after all. In fact, price perception is slightly more associated with emotional connection than perception of the quality of products and store experience:
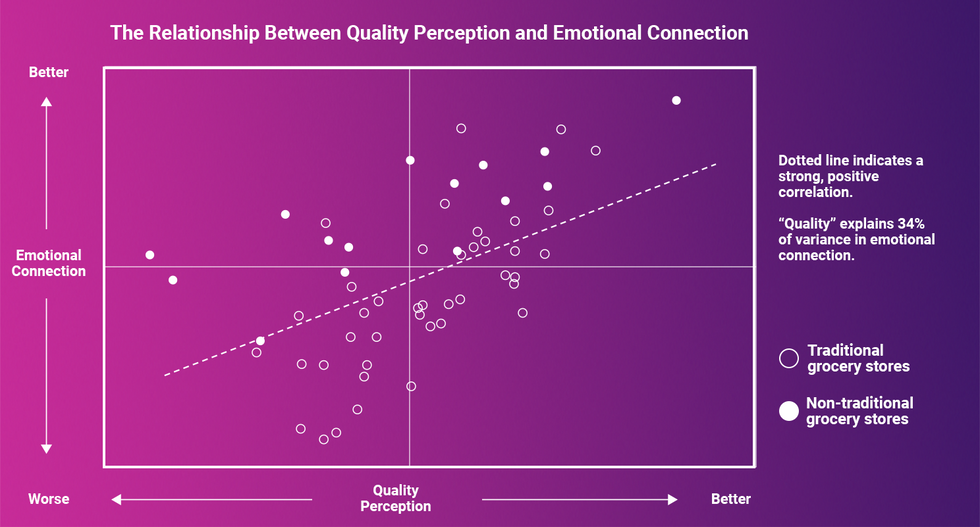
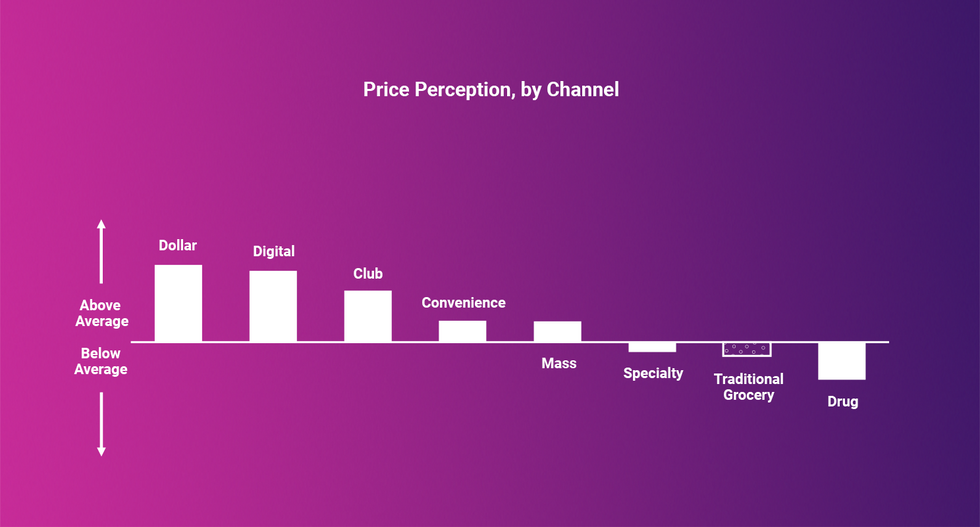
And, whereas traditional grocers have managed to hold their own on quality perceptions, they lose on price perception.
So, where does the traditional grocer start if they want to win back the hearts of their local constituents? After all, there are many levers they can pull within pricing, assortment, and store experience to move perceptions. A close look at data from our 2019 Retailer Preference Index: Grocery Channel Edition offers some hints. Stores who have the strongest emotional connection separate themselves from the pack with the following:
- Private brands that customers love
- Leading prices on natural and organic items
- Fast checkout
- Staff who show they value shoppers
Translated into language customers might use, that means:
- Have products I can't get anywhere else, at competitive prices
- Make healthy food affordable
- Don't waste my time
- Treat me like a person
Of the 56 retailers ranked by emotional connection, 24 of the bottom 25 are traditional retailers. And while Aldi, ranked 17th for emotional connection, has been used as a stark example to illustrate traditional grocers' emotional connection issue, many other non-traditional stores have a stronger emotional connection with their shoppers than Aldi does with theirs.
However, 3 traditional grocery stores buck the trend and join non-traditional retailers in the top 10: Market Basket (4th), H-E-B (5th) and Publix (6th). They each check more than one of the boxes on the core ingredients of emotional connection.
These retailers, more than any other traditional, regional grocer, have established with their emotional connection an insurance policy for an uncertain grocery industry future. And the prevalence of non-traditional grocers with superior emotional connection proves the point that this insurance policy is more a product of "what have you done for me lately" than a product of consumer nostalgia. Non-traditional grocers are buying emotional connection with better prices while delivering on some combination of a superior private label, offering the best natural and organic prices and having staff who show they value customers.
The reality is that this is not a new format—rather the customer-led repurposing of a familiar one: the traditional, regional grocery store. This finding comes from a follow-up analysis of data collected for the recent 2019 Grocery Retailer Preference Index report, a report which identified winners and losers among the 56 largest retailers in the U.S. Grocery Retail Industry. In this follow-up analysis, we examined the types of trips people took (e.g. bigger vs. smaller) to each retailer, as well as the categories they bought (e.g. produce, ready-to-eat or paper products). The findings cast further light on the problems faced by traditional grocers in an evolving grocery landscape that has seen national mass, club, drug, dollar, convenience and digital players invest more in the grocery game the past few decades.
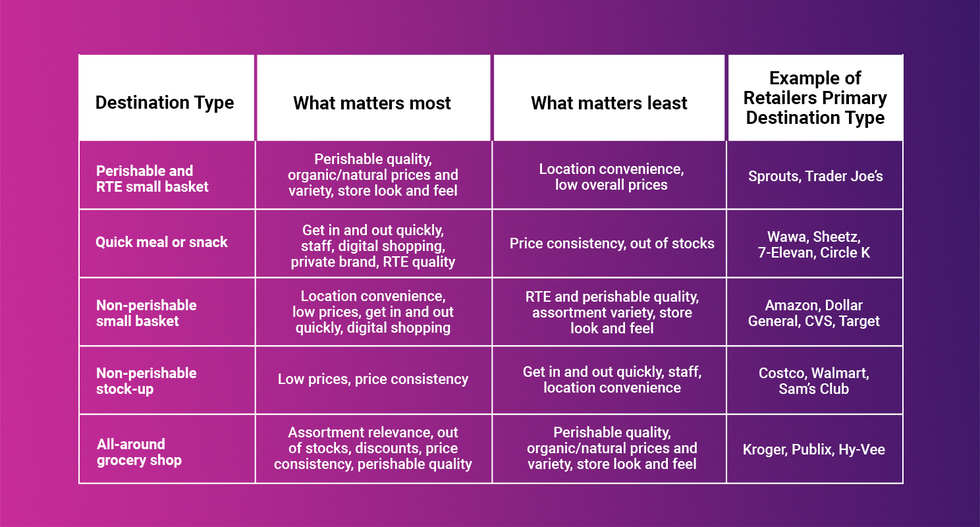
When considering trip types and categories sought by customers, five general types of retail destinations emerge:
- All-around grocery shop
- Perishable and ready-to-eat small basket
- Quick and convenient meal
- Non-perishable stock-up
- Non-perishable small basket
Certain channels lend themselves to certain destination types. Specialty grocers like Trader Joe's or Sprouts, with fewer SKUs and smaller formats than the traditional grocer, tend to fall in the "Perishable and ready-to-eat small basket" destination type. Club and mass are non-perishable stock-up destination. Drug, dollar and digital in non-perishable small basket. C-stores in quick and convenient meals. However, many traditional grocers have an identity crisis. Only 6 in ten are seen primarily as "all around grocery shop" destinations, despite all of them carrying the full complement of SKUs.
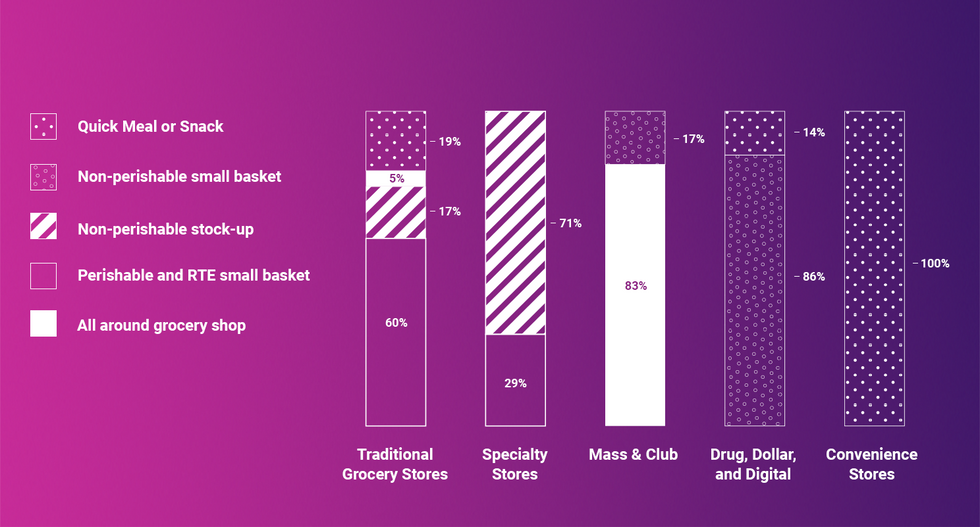
In other words, almost half of traditional grocery stores are shopped more like a convenience and specialty store than like a store with 10-20x more products than that. At best, categories beyond perishable and RTE food are typically an afterthought and only shopped in a pinch. At worst, those categories are bypassed completely by shoppers, who instead buy the same products for cheaper at widely available mass, club, digital, dollar or drug channels.
The result of being treated as a perishable c-store is a lower share of customer wallet. Traditional grocers who are all-around grocery destinations win 33% of their customer's share of wallet, versus only 20% for traditional grocers shopped like a perishable c-store.
So, what can traditional grocers who are not being viewed as an all-around grocery shop do about it?
According to an analysis of customer needs gathered from a survey sent to 7,000 shoppers in the U.S., if traditional grocers want to ensure they'll be an all-around grocery shop, they need to ensure some key ingredients are in place:
- Highly relevant assortment, which is rarely out of stock
- Prices that are consistent on inelastic and competitive on key-value items, while offering discounts on the products that are important to customers and responsive to promotions
- Decent perishable quality
For now, traditional retailers aiming to be all-around grocery shops can trade-off on having the best digital offering and the best ability to get customers in and out quickly. These things are less important to customers when picking an all-around grocery destination.
While some traditional grocers are struggling to win the title of all-around grocery shop, one non-traditional store isn't: Aldi. Aldi's consistently industry-leading prices and their ability to manage out of stocks and store cleanliness just as well as your average traditional grocery store, has made them a stock-up destination for perimeter categories, like produce and dairy, as well as center store packaged food items. As a result, despite having stores which carry less than 2,000 SKUs, Aldi's share of customer wallet is in line with that of the average traditional grocery store, which often carry more than 40,000 SKUs.
Of course, the reality is that no single non-traditional competitor is eating away at traditional grocers' hold on the all-around grocery shop. Rather, a host of non-traditional competition, each with unique value propositions, are all taking small bites, which add up. The data suggests that this is because traditional grocers took their eye off the retail basics, perhaps because they grew complacent after decades of dominance and relatively little industry disruption from non-traditional substitutes.
So, the call to action is clear: before overinvesting on any shiny new toys, like eCommerce or technology to speed up checkout, get back to your roots and make sure you're offering the right prices on the right products.