In dunnhumby's second annual Retailer Preference Index (RPI) study, a comprehensive nationwide study, we re-examine the evolving US grocery landscape to help retailers navigate an increasingly fragmented market where shoppers are, on average, shopping at four grocery stores per month and regularly buying groceries from at least three other channels. The study focuses on the following questions:
- What drives preference?
- Who is winning and losing?
- Why are they winning or losing?
- What can grocery retailers do to improve preference and performance?
Existing retailer rankings by Consumer Reports or Market Force only use survey data to capture how shoppers feel about the various banners without linking the emotion to financial performance. Others, like Supermarket News, rank banners based on financial metrics but fail to capture how people feel.
Our study is different because it quantifies the preference driver importance based on a combination of a banner's emotional connection and financial performance. The emotional connection was captured through a 15-minute online survey across 7,000 US households about how customers think and feel about 56 US grocery retailers.
The list of banners evaluated, in alphabetical order, include:
Acme
Albertsons Aldi Amazon Big Y Foods Bi-Lo BJs Wholesale Brookshires Costco Food City Food Lion Food4Less/Foods Co. Fred Meyer Frys Food Stores Giant Eagle Giant Foods Hannaford Harris Teeter H-E-B Hy-Vee |
Ingles Markets
Jewel-Osco King Soopers Kroger Lidl Lowes Foods Market Basket Meijer Peapod Price Chopper Publix Raley's Ralphs Safeway Sam's Club Save Mart Schnucks Shaws/Star Market ShopRite Smart & Final |
Smiths
Sprouts Farmers Market Stater Bros Stop & Shop Supervalu Target The Fresh Market Tops Trader Joes Vons Walmart Walmart Neighborhood Wegmans Weis Markets WinCo Winn-Dixie |
---|
To learn more, download a free copy of the report. If your banner is in our report and you'd like your custom brief, contact us.
Keep Reading...Show less
Download Report
https://roar-assets-auto.rbl.ms/documents/7505/dunnhumby-Retailer-Preference-Index-2019-Grocery-Edition.pdf
True
Covid-19 has fundamentally changed shopping behaviour in a short space of time with shoppers visiting fewer stores less often, but leaving with bigger baskets. Ecommerce sales have near tripled, leaving some Retailers struggling to meet demand and cannibalising in-store margins. What's more, these changes are anything but transitional, with lockdowns and social distancing of some variety likely to dominate society for the foreseeable future, or until a vaccine is released.
With price sensitivity likely to resurface as a recession kicks in, continued disruption to supply chains, and a potential price war in the making as cash-rich retailers fight to retain newly acquired Shoppers and market share, the implications for CPGs and their retail partners are varied and potentially vast.
This report explores how CPGs can maintain a collaborative, win-win relationship with Retailers in the face of changing shopper needs.
Keep Reading...Show less
Download Report
https://roar-assets-auto.rbl.ms/documents/7820/Life-after-the-curve-for-Retailers-and-CPGs.pdf
True
In our third annual Retailer Preference Index (RPI) for the U.S. grocery channel, we look at the $700 billion grocery industry which finds itself potentially less than a year away from an economic downturn, according to many economists. Which grocers are best prepared to weather the storm, and what can other retailers do to compete? The RPI seeks to answer these and other questions, including:
- What drives customer preference for grocery retailers?
- Which retailers are winning and losing? And why?
- What can grocery retailers do to improve performance and win more trips?
Existing ranking methods focus primarily on retail growth based on store counts and revenue size, without linking growth to emotional or financial performance. We have a different perspective, one that focuses on the consumer and their emotional connection to the various retailers within the grocery channel. Our study surveyed 7,500 US consumers to uncover how they think and feel about grocery stores, and how they shop them. All with a goal to understand how Customers perceive stores through seven different drivers, and how these perceptions affect both the emotional connection and financial performance.
Our goal: to help retailers better understand their customers to deliver a value proposition that aligns with their needs, to earn more trips and drive sustainable growth.
To learn more, download a free copy of the report. If your company is in our report and you'd like your custom retailer profile, contact us.
Keep Reading...Show less
Download Report
https://roar-assets-auto.rbl.ms/documents/7807/2020_dunnhumby_Retailer_Preference_Index_Grocery_Edition%20(1).pdf
True
Data warehouse
Photo by Tobias Fischer on Unsplash
As disruption in the retail industry accelerates, more companies are turning to technology to keep up with new market entrants and changing consumer trends. But taking the focus off of Customer needs as the core driver of CRM strategy, retailers are missing opportunities for meaningful Customer interactions and profitable growth.
In this report, we'll take a closer look at the five big myths behind the trend of putting technology at the center of CRM strategies, revealing why a Customer First approach will help improve engagement with your Customers, which may just be the answer for ineffective tech solutions.
Download the report
https://roar-assets-auto.rbl.ms/documents/7787/dunnhumby_There_is_no_T_in_CRM.pdf
True
shallow focus photography of person holding smartphone
Photo by Jonas Leupe on Unsplash
Facing rising costs and shrinking margins, finding new revenue streams should be an urgent priority for grocery retailers the world over. Blessed with volumes of valuable customer data and a rich menu of owned media, this unbeatable combination provides enormous scope for creating sustainable growth. Yet so many grocery retailers are struggling to make this a reality.
To better understand why so many retailers aren't taking advantage of new revenue streams while improving the shopping experience for their customers, we commissioned a global study with Forrester Consulting. Download your complimentary copy of Forrester's research to learn about the barriers holding retailers back from revenue generation and the recommendations to overcome the challenges.
Key findings
- 85% of grocery retailers have identified creation of new revenue streams as a priority for 2020
- Despite high levels of confidence in their data strategies, only 15% of retailers have the right capabilities, people, technology, and processes to improve customer experience and monetize their data.
- Most are also missing out on lucrative revenue through monetizing their media. Challenges with data, technology, expertise, and culture are the greatest barriers to progress.
- Retailers who are able to successfully utilise data insights, are reaping benefits with 61% seeing an improvement in the customer experience and 56% seeing growth in existing revenues and revenue streams.
Keep Reading...Show less
Download Report
https://roar-assets-auto.rbl.ms/documents/7819/Forrester__The_Future_of_Retail_Revenues_Must_be_Data_Led.pdf
True
In dunnhumby's inaugural Retailer Preference Index (RPI) study, a comprehensive nationwide study, we explore the evolving US grocery landscape to help retailers navigate an increasingly fragmented market, where shoppers are, on average, shopping at four grocery stores per month and regularly buying groceries from at least three other channels. The study focuses on the following questions:
- What drives preference?
- Who is winning and losing?
- Why are they winning or losing?
- What can grocery retailers do to improve preference and performance?
Existing retailer rankings by Consumer Reports or Market Force only use survey data to capture how shoppers feel about the various banners without linking the emotion to financial performance. Others, like Supermarket News, rank banners based on financial metrics but fail to capture how people feel.
Our study is different because it quantifies the preference driver importance based on a combination of a banner's emotional connection and financial performance. The emotional connection was captured through a 15-minute online survey across 11,000 US households about how customers think and feel about 50+ US grocery retailers.
To learn more, download a free copy of the report. If your banner is in our report and you'd like your custom brief, contact us.
Keep Reading...Show less
Download Report
https://roar-assets-auto.rbl.ms/documents/7817/dunnhumby%20Retailer%20Preference%20Index%202018-%20Grocery%20Edition.pdf
True
Customer First Radio Episode 5 | Ted Eichten, Head of Price & Promotions, North America for dunnhumby
April 21 2021
FOR RETAILERS
Smarter operations and sustainable growth, powered by Customer Data Science.
FOR BRANDS
Better understand and activate your Shoppers to grow sales.
Customer First Radio Episode 4 | Daryl Wehmeyer, Head of Category Management, North America for dunnhumby
February 17 2021
Retail leaders must objectively understand how their business currently considers Customers before trying to set a more Customer-centric direction and focus. There are some formal assessment methodologies, like dunnhumby's Retail Preference Index (RPI) and Customer Centricity Assessment (CCA), which offer detailed evaluations of a business' capabilities, strengths and weaknesses based on Customer perceptions (RPI) or global best practices (CCA).
The approach outlined below is not intended to replace these formal tools; rather, these observations are intended as a kind of 'toe in the water' to help retail leaders form early hypotheses and points of views. These are rules of thumb, heuristics culled from global experience. Later, leaders might use these observations to informally check progress from time to time as a way of assessing whether the "program in the stores matches the program in our heads".
Hence, the context and laboratory for these suggestions is the retail store, where the rubber meets the road, so to speak.
1. Who really runs the store?
Walking around a store (or better, walking around several), can give many clues toward understanding a retailer's attitude about its Customers, as well as revealing some of the challenges ahead for installing Customer First. As Customers ourselves, we are qualified to assess an organization's 'readiness' for Customer First, simply starting by walking around.
How a Customer experiences the store shapes their perception of the brand, and there are dozens (even hundreds) of 'moments of truth' for Customers in each shopping trip – opportunities for the retailer to win more loyalty, or indeed to lose it. And it only takes one 'bad' experience to erase all the good.
Leaders can form an opinion about the Customers' true shopping experience by observing 'Who really runs the store?' – a way to put on a Customer lens to assess if the Customer, the retailer, the supplier, or no one is driving shopping experience decisions, like range and presentation. For example:
- Choose three sections across the store (telling categories include yogurt, pasta sauces, milk, and packaged lunch meats). Look to see how the product is organized and presented (remember to try to see through the eyes of a Customer).
- Is the section organized by brand (e.g. all Danone yogurt is merchandised together in a recognizable Danone brand block)?
- By Customer benefit or usage (e.g. all brands of probiotic yogurt are merchandised together, as are all Greek style yogurts, all kid's yogurts, etc)?
- Or, by some hybrid but logical planogram rather random plan, with little recognizable logic at all?
- Would you conclude that the product display / layout logic is influenced more by supply chain, by brands, or by the Customer need states or trip missions?
- How broad is the range (e.g., number of varieties or sizes)? How deep (e.g., number of brands of the same flavor or variety)? Does the breadth and depth feel Customer friendly, or confusing?
Of course, analysing any available loyalty data will later tell us how Customers shop the category and that might well be by brand (or flavour or size, etc., and will certainly vary by section). But this first assessment helps us begin to form our perspective on how tuned-in the business is around its Customers, and about where within the business leaders might need to begin to install insights and the Customer language.
2. What messages are Customers receiving?
Store signage not only delivers a written message, but also a type of 'body language' that Customers tune in to, albeit not always consciously. Look around the store to see both the written and hidden messages, and hear the tone being communicated: ask, do messages speak respectfully to Customers? For example:
- Signage at the entrance rudely telling Customers what the rules are, even though 99.999% of Customers will never even think of shopping without shirts or shoes, or wearing roller blades
- Narrow limits on the quantities of promoted products or services.
- Rules and restrictions, terms and conditions.
- Aggressive security barriers and gates at entrances – although sometimes operationally necessary, these also tell honest Customers that they, the shoppers, are not to be trusted.
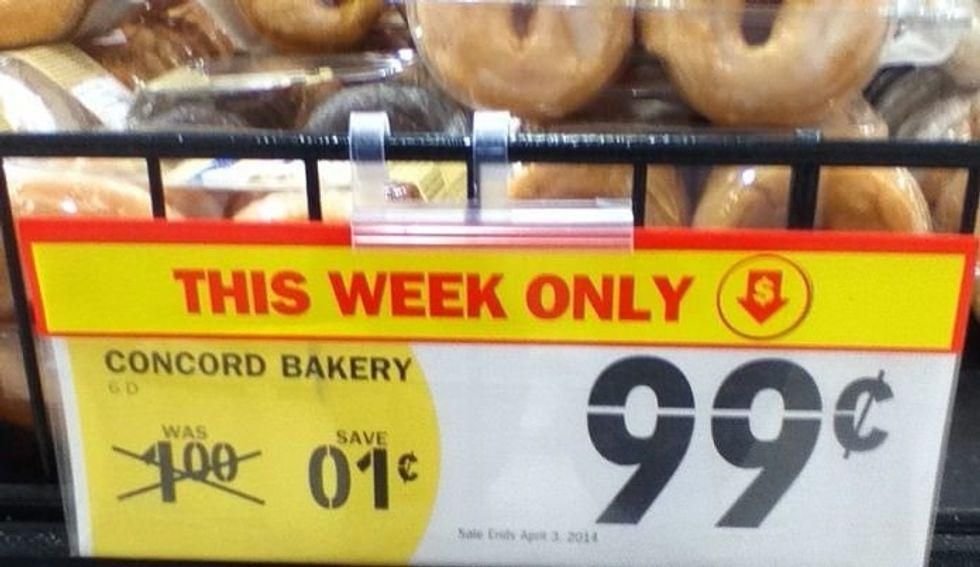
- Phony expiration dates for promoted prices – Customers learn that the deal will be repeated soon, if not immediately. Best example is the many carbonated soft drink promotions below shelf price that are repeated frequently, and the innumerable 'roller' prices practiced by many retailers.
- Stupid pricing signs (any stupid sign, really).
3. What messages are Employees receiving?
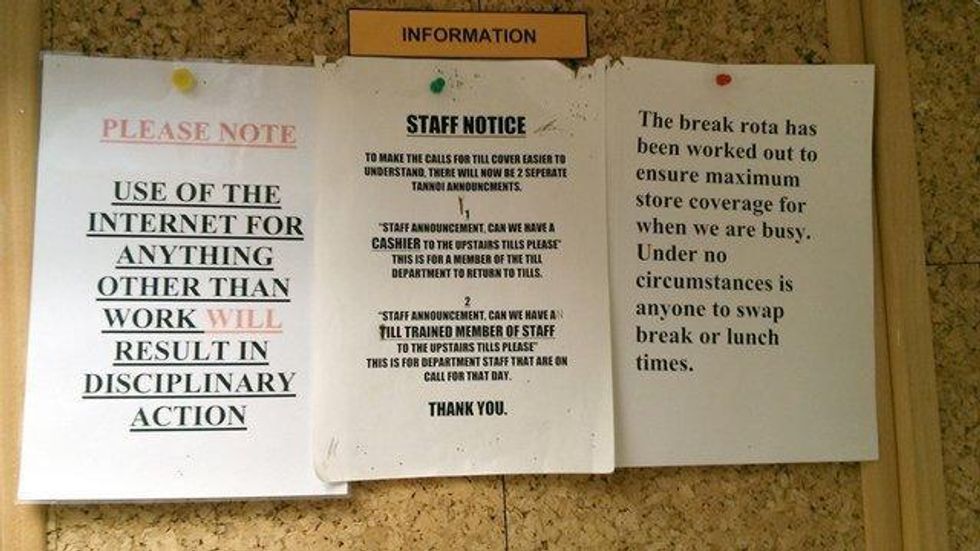
While walking the store, traveling through stock rooms and the employee break room, note the signage and messaging aimed at staff. What seems to be valued more – numbers or people?
What policies and rules guide employee behaviour?
How are they expected to interact with Customers?
Are the messages respectful of staff? Of Customers?
What do signs say about the culture around Customers?
4. Who has the power to satisfy Customers?
dunnhumby's Loyalty Drivers analysis suggests that Customers exhibit four 'mindsets' in their shopping journey – Discover, Shop, Buy, and Reflect. One element of the 'Reflect' mind-set includes the decision to return, exchange, or to request a refund when the product or service does not quite suit.
On your store walk, observe who has the power to satisfy Customers making a return or wanting a refund: is the front-line employee empowered to satisfy the Customer, or must the Manager be called? Is there one 'service' desk where Customers must queue to get their money back, or can the helpful cashier make it good on the spot?
Examine the return policy to assess its sensibility and ease from a Customer viewpoint. For example, must a Customer act within 7 or 30 days, and is a receipt required and signature under penalty of perjury? Is the taking of an oath necessary, or perhaps a drop of blood? The store's practice says volumes about who deserves trust in the eyes of the business. Requiring levels of approvals and higher management involvement (or some other form of hoop-jumping) is neither trusting of employees nor Customers.
The return / refund policies and practices are strong indicators of a company's readiness for, or progress along the Customer-centric journey. Customer First organizations give front-line employees broader authority to resolve Customer needs, and extend the power to satisfy Customers to most members of staff, in some form. For best practices in this area, please see the policies from Nordstrom in the U.S. and Ritz-Carlton globally.
5. Do the words of your leaders matter?
Senior leaders set the tone for how Customers are regarded and treated in the business both by their words and their actions, of course. And the C.E.O.S – Customers, Employees, Owners, and Suppliers – all take notice. It's widely documented that leaders who walk the walk are more effective than those who only talk the talk.
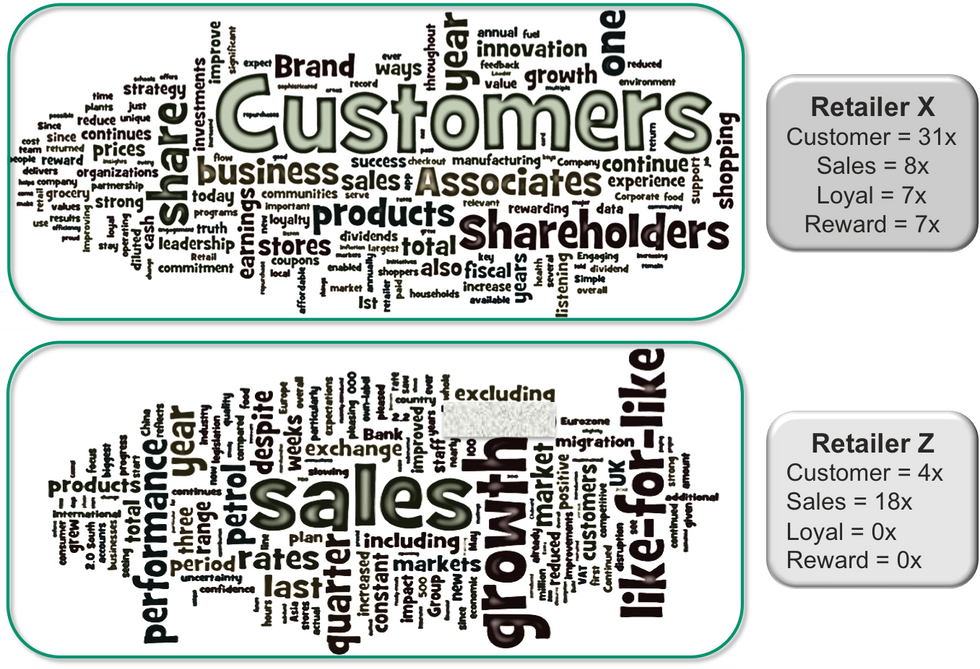
One simple yet powerful way to assess readiness and progress is seeing how leadership's walk and talk align. A word cloud, like the one illustrated below, makes the point very clear. In this example, recent shareholder statements (same quarter) were compared for two companies on a Customer-centric journey. We can see different progress in a form of 'walking the walk' at Retailer X and Retailer Y. The C.E.O.S are hearing what really matters to the leaders, and are forming the Customer culture accordingly, all the way down to store level.
Implications for retail leaders
The store shapes Customers' perception of the brand; there are hundreds of opportunities for the retailer to win or lose loyalty in each shopping trip. Customers take clues, consciously and unconsciously, throughout their entire shopping experience, and draw conclusions about retailer warmth and attitude toward shoppers. And it only takes one disappointing experience to erase all the good.
Retail leaders must take an objective assessment of the shopping experience using a Customer lens to understand their current state and readiness for customer centricity. Pay close attention to the body language and tone of your policies. Store signage, employee empowerment and communications, and practices around assortment and presentation are clear indicators of the organization's attitude about the Customer.
Who actually runs your store?
This is the first in a series of LinkedIn articles from David Ciancio, advocating the voice of the customer in the highly competitive food-retail industry.
Keep Reading...Show less
Photo by Jonathan Velasquez on Unsplash
In the first episode of Customer First Radio, Dave Clements, Global Head of Retail for dunnhumbyand David Ciancio, Global Head of Grocery for dunnhumby kick off the series by discussing what it means to be a truly Customer First business, share which retailers and brands today embody a Customer First mindset, and examine how Customer First materialized during the pandemic with retailers.